Q3 2026 - Market Insights
Every quarter, we’ll highlight and explain a few of the key events that happened leading up to the quarter, as well as some takeaways and insight into the impact these events may have going forward. If there are any topics that you’d like us to touch on in the future, please reach out and let us know.
Q2 2026 Market Review
The third quarter of 2026 saw more of the same in many areas of the market. In areas like bonds, housing costs and oil, more of the same was not necessarily a welcome sight. Here’s a look at some of the results that mattered most over the past three months.
Large Caps Hold On as Small Caps Slide
As we highlighted in last quarter’s market update, equity markets saw a broadening beyond the mega-cap tech stocks that had led the market for the past few years. The third quarter saw that trend reverse, with large cap and tech-focused stocks leading the way again, thanks to a late-quarter rally, while small cap stocks gave back some of their hot start to the year. Despite this, small cap stocks, as represented by the Russell 2000® index, still outpace the S&P 500® for the year as of quarter end (1).
Small cap stocks tend to be sensitive to bond yields since higher borrowing costs weigh disproportionately on smaller companies with floating-rate debt. We saw this play out in the third quarter, as the 10-year Treasury yield climbed from 4.47% at the end of June to 5.23% at the end of September while the Russell 2000® fell about 7.2% (1, 2).
Bond Yields Climb to a 24-Year High
Over the past three months, bond yields continued their climb to levels not seen since 2002. As of 9/30/26, the yield on the 10-year U.S. Treasury note closed at 5.23% (2). When bond yields rise, the price of the underlying bonds drops, which means anyone already invested in the bonds sees their value drop. There are many factors influencing the prices and yields of bonds, but some of the main culprits for the quarter were persistent inflation, growing government debt and the wave of new Treasury bonds the government is issuing to pay for that debt.
The 10-year Treasury yield is the benchmark for many of the interest rates people pay in everyday life. As a result of the increasing 10-year rate, rates on mortgages, auto loans and business loans will likely increase.
The flip side is that anyone putting new money into bonds today is earning yields that haven’t been available in more than 20 years. Where rates go from here will depend largely on inflation, which is tied closely to what happens with oil prices and housing costs.
The Energy Rollercoaster Continues
Ever since the conflict in Iran began earlier this year, we have seen greater than usual volatility in oil. The reprieve we saw in the late spring didn’t last long into the third quarter. The price of WTI crude ended Q3 at $90.42, after climbing above $100 in mid-September. The price of oil influences many different areas of the economy, but probably most apparent is the price of gas at the pump. Nobody likes seeing upwards of triple digits for a tank of gas, but when we zoom out, we can see that while high, we have seen oil prices at this level in recent times. In the past 20 years, the average annual price of oil was higher than this year’s average in 6 of those 20 years(3). The sharp and sudden rise we saw over the summer plays a big role in why this “hurts” more than usual.
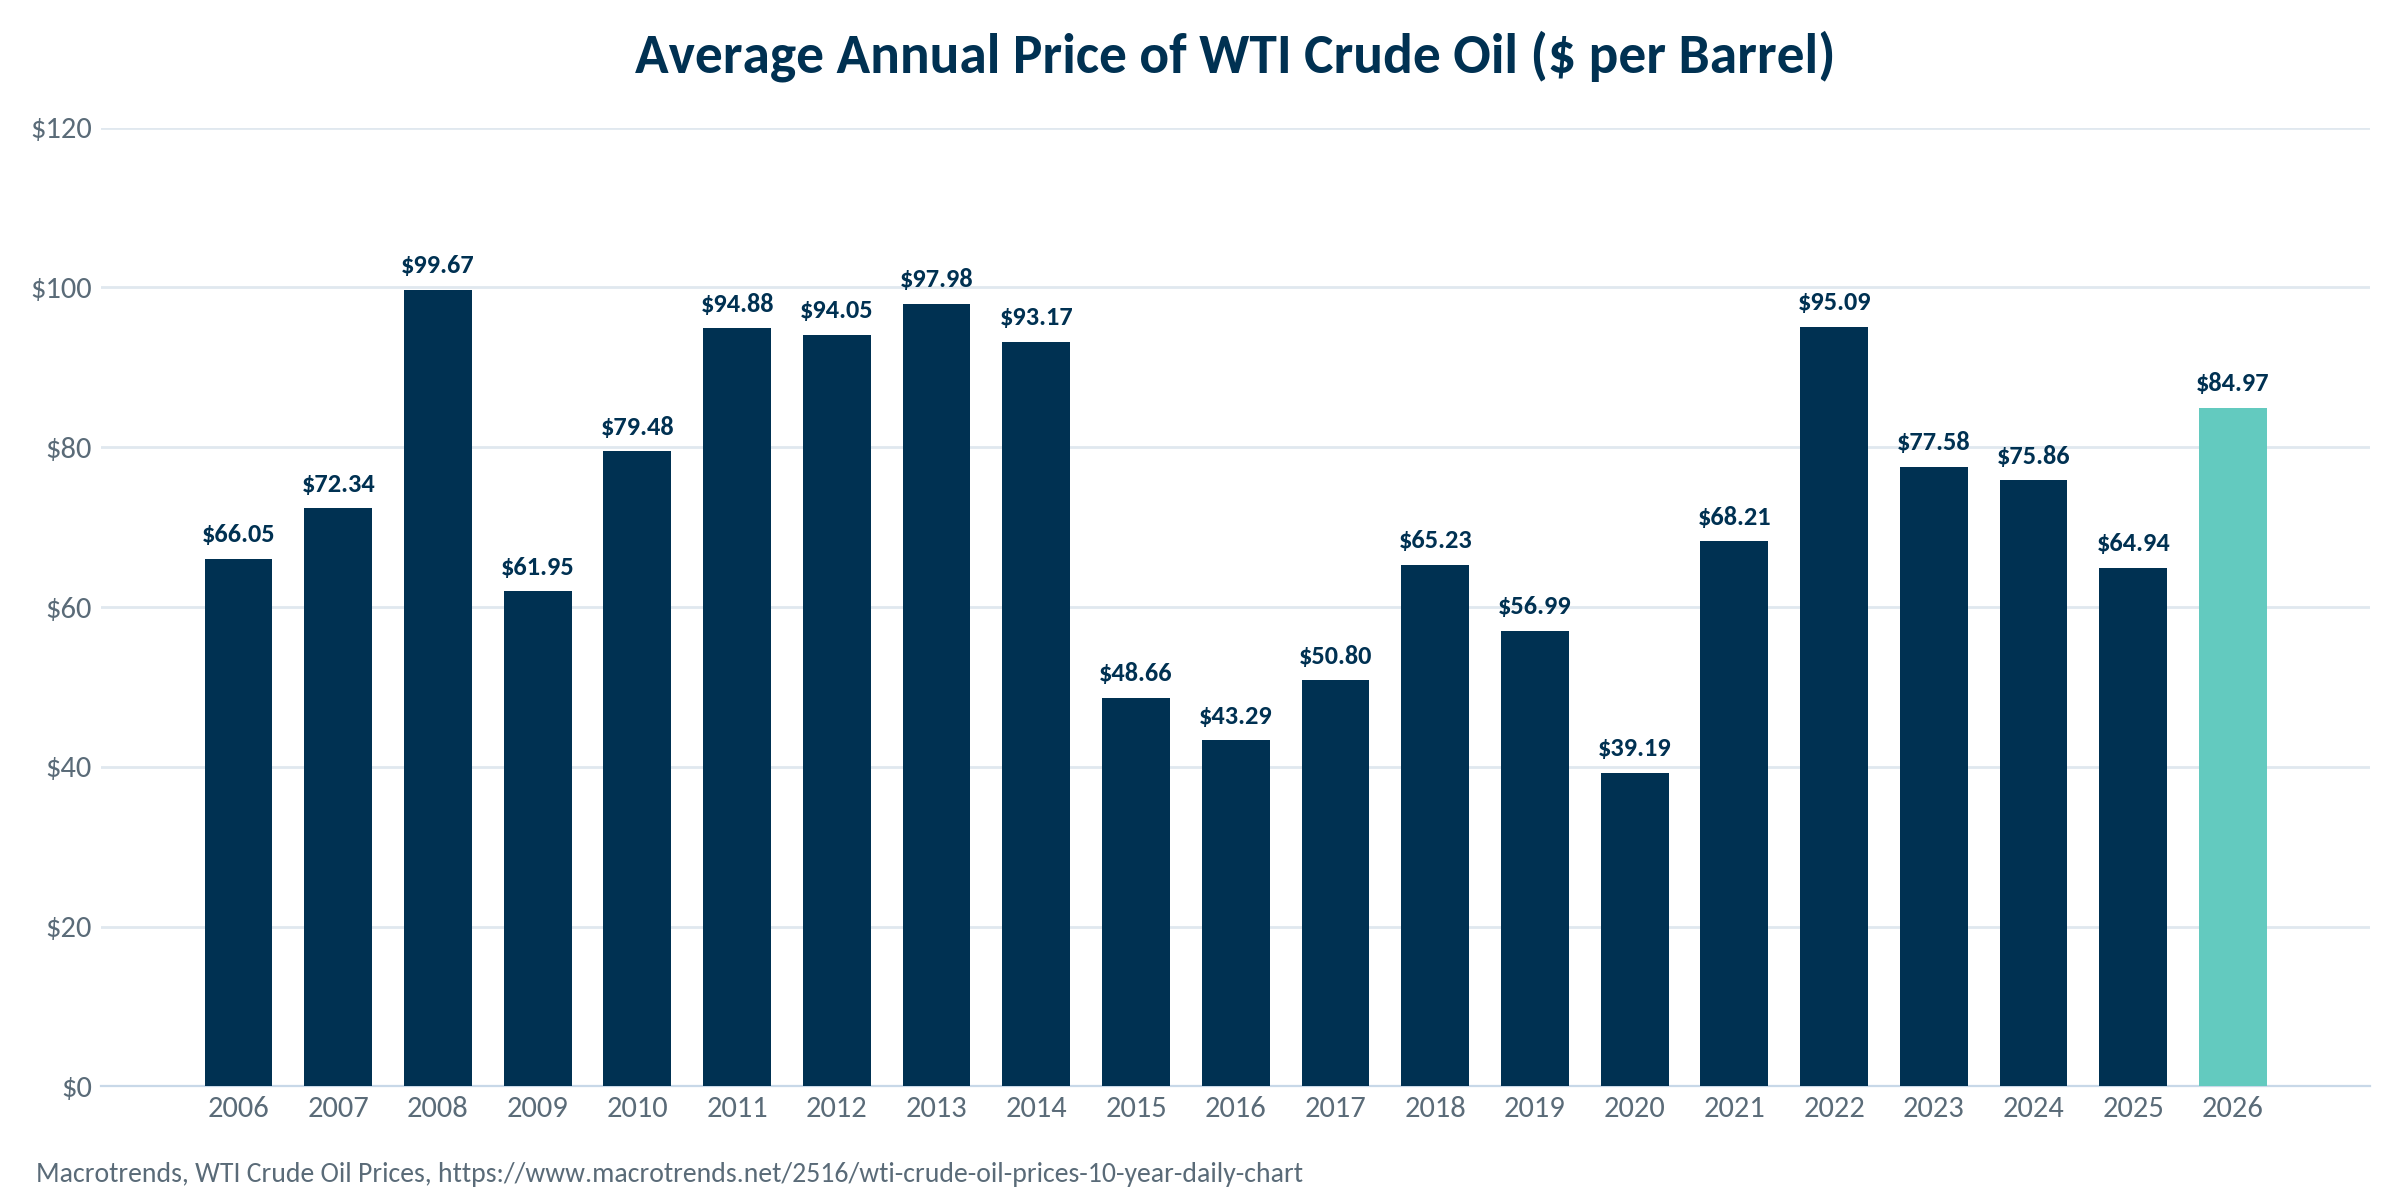
Macrotrends, WTI Crude Oil Prices, https://www.macrotrends.net/2516/wti-crude-oil-prices-10-year-daily-chart
The Cost of Buying a Home Keeps Climbing
Another area of pain, and one that isn’t necessarily new, is the cost of buying a home. As bond yields climb, mortgage rates follow, which keeps pushing monthly payments higher. Nationwide, home prices are leveling off, with certain areas actually showing decreases. Even where prices have dipped, a higher mortgage rate usually more than makes up the difference, so affordability is still a real problem. After adjusting for inflation, the monthly payment on a median-priced home is the highest it’s been in at least 20 years, and roughly $1,000 a month more than it was in 2019 (4).
Feeling Worse, Spending More
Despite the increasing price of oil, housing and persistent inflation across the U.S. economy, one of the more fascinating statistics recently is that the American consumer continues to spend. The dollar amount spent by U.S. households rose by 6.1% in the past 12 months through August, while general consumer prices were up about 3.4% over that same period (5).
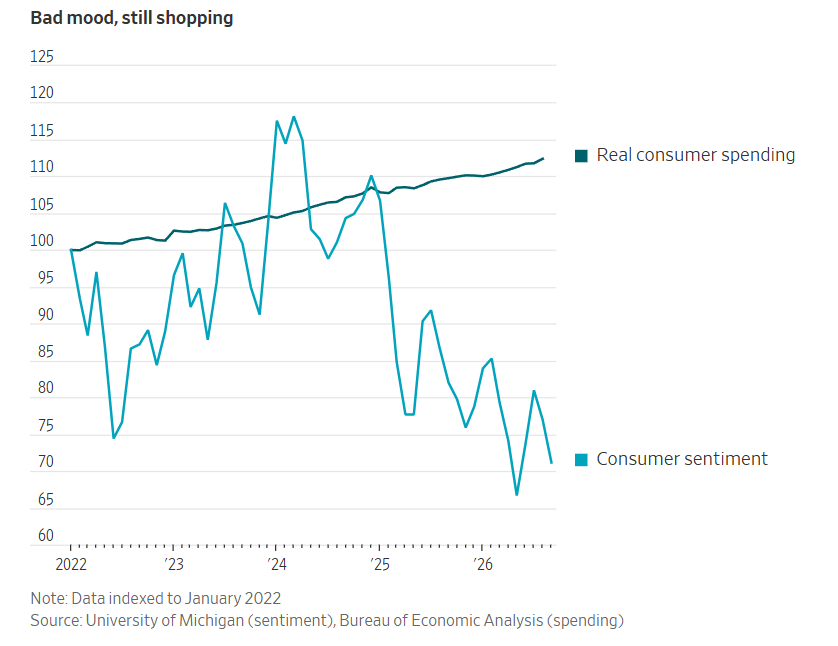
The Wall Street Journal, https://www.wsj.com/economy/consumers/american-economy-consumer-profile-33903de1
What is most interesting is that while consumers continue to spend more, consumer sentiment sits near a 12-year low and remains well below its long-term average5. Historically, consumer spending and consumer sentiment have moved in the same direction: when sentiment about the economy is down, people tend to spend less money and vice versa. People may not feel great about the economy right now, but they’re still opening their wallets, and with consumer spending making up roughly two-thirds of U.S. GDP, that’s a big part of why the economy has held up as well as it has.
Summary
The third quarter was a mixed bag for investors, with large cap stocks leading the way again while small caps gave back some of their gains from earlier in the year. Bond yields climbed to levels not seen since 2002, which pushed bond prices lower and mortgage rates higher. Oil and the cost of buying a home were two of the more painful areas for households this quarter, though oil looks a lot less extreme when you zoom out over the past 20 years. Despite all of that, the American consumer kept spending, even with sentiment about the economy sitting near a 12-year low.
If there are any topics you would like us to address in the future, please let us know.
Sources
Koyfin, Russell 2000® Index Data, https://www.koyfin.com/
CNBC, U.S. 10 Year Treasury, https://www.cnbc.com/quotes/US10Y
Macrotrends, WTI Crude Oil Prices, https://www.macrotrends.net/2516/wti-crude-oil-prices-10-year-daily-chart
Elevate Wealth Management calculation using data from the National Association of Realtors (median existing-home sales price), Freddie Mac (Primary Mortgage Market Survey) and the U.S. Bureau of Labor Statistics (CPI-U)
The Wall Street Journal, https://www.wsj.com/economy/consumers/american-economy-consumer-profile-33903de1
Disclosures
Investment advisory services offered through Elevate Wealth Management, LLC, a registered investment advisor. The firm’s ADV 2A Brochure and Form CRS are available, at no charge, by request at information@elevateasset.com or 307.461.5550 and are available on our website www.elevateasset.com. They include important disclosures and should be read carefully.
Information provided herein reflects Elevate’s views as of the date of this newsletter and can change at any time without notice. Elevate obtained some of the information provided herein from third party sources believed to be reliable, but it is not guaranteed and Elevate does not warrant or guarantee the accuracy or completeness of such information. The use of such sources does not constitute an endorsement. Elevate’s use of external sources should in no way be considered a validation. The views and opinions of these authors are theirs alone. Reader accesses the links or websites at their own risk. Elevate is not responsible for any adverse outcomes from references provided and cannot guarantee their safety. Elevate does not have a position on the contents of these articles. Elevate does not have an affiliation with any author, company or security noted within.
Past performance is no guarantee of future returns. Performance discussed represents total returns that include income, realized and unrealized gains and losses. Nothing presented herein is or is intended to constitute investment advice or recommendations to buy or sell any types of securities and no investment decision should be made based solely on information provided herein. There is a risk of loss from an investment in securities, including the risk of loss of principal. Different types of investments involve varying degrees of risk, and there can be no assurance that any specific investment will be profitable or suitable for an investor’s financial situation or risk tolerance. Diversification and asset allocation do not ensure a profit or protect against a loss. All performance results should be considered in light of the market and economic conditions that prevailed at the time those results were generated. Before investing, consider investment objectives, risks, fees and expenses.
Exclusive reliance on the information herein is not advised. This information is not intended as a recommendation to invest in any particular asset class or strategy or as a promise of future performance. References to future returns are not promises or even estimates of actual returns a client portfolio may achieve. Assumptions, opinions and estimates are provided for illustrative purposes only. They should not be relied upon as recommendations to buy or sell any securities, commodities, treasuries or financial instruments of any kind. This material has been prepared for information purposes only and is not intended to provide, and should not be relied on for, accounting, legal, investment or tax advice.
In reviewing the performance information presented here, we recommend that you consider both the returns generated and the level of risk that was assumed in generating those results. We believe that performance information cannot be properly assessed without understanding the amount of risk that was taken in delivering that performance. The performance information presented here covers different time periods. We present performance information for short time periods because we understand that clients and potential Investors are interested in this information, however, we recommend against making any investment decisions based on short-term performance information. For any investment products mentioned herein, a complete description of their investment objectives, along with details of the risks and fees involved is contained in their respective prospectus and statement of additional information, which is available on their websites and should be read fully.