
Q2 2026 - Market Insights
Every quarter, we’ll highlight and explain a few of the key events that happened leading up to the quarter, as well as some takeaways and insight into the impact these events may have going forward. If there are any topics that you’d like us to touch on in the future, please reach out and let us know.
Q2 2026 Market Review
If the first quarter of 2026 was defined by geopolitical shocks, the second quarter of the year was defined by resilience, de-escalation, and a historic Initial Public Offering (IPO). Let’s explore a few of the major themes and metrics that drove the economy and capital markets this past quarter.
The Large-Cap Rebound
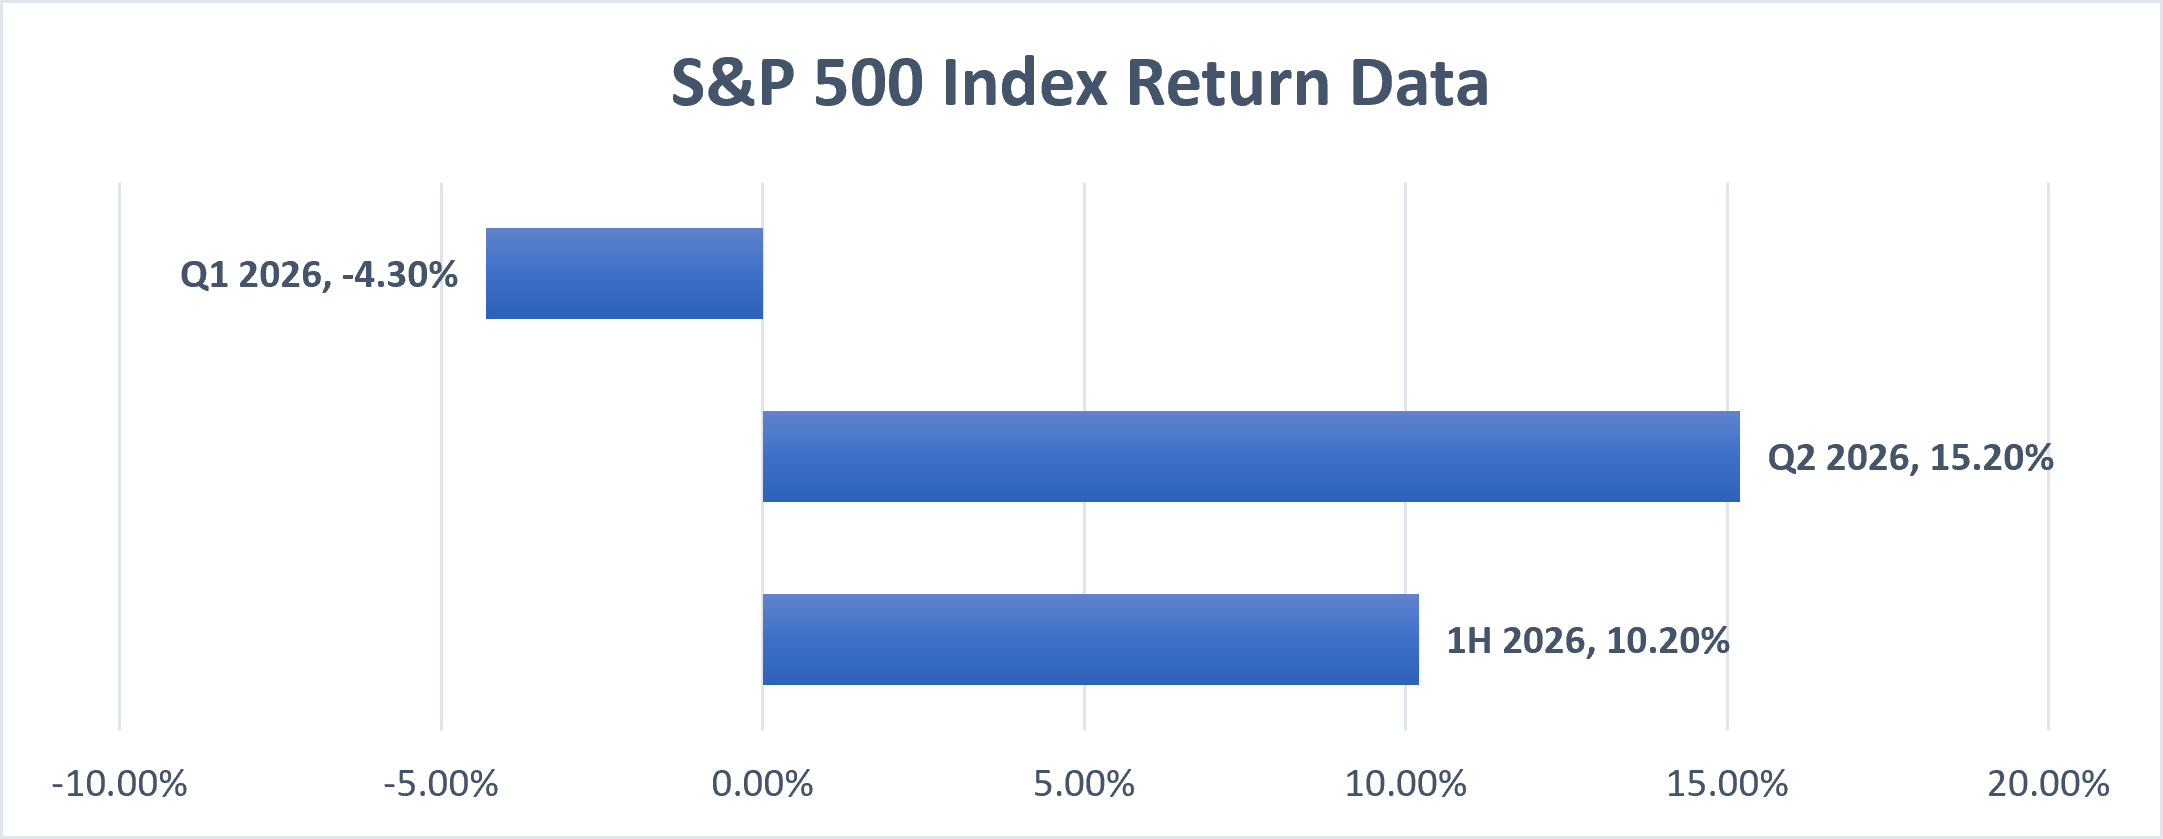
After a turbulent first quarter, equity markets roared back to life in Q2. In early April, with the announcements of Middle East peace talks and the presumed energy stabilization to follow, large-cap equities made quite the comeback from their first quarter woes. Another driving factor was an impressive corporate earnings season that improved investor confidence across most global equities.
The S&P 500® index, most people’s preferred barometer of large US stocks, recovered its first-quarter losses and then some in Q2. This was due in large part to an earnings season where more than 80% of companies in the index beat their quarterly estimates, helping bring the index back to the black in the first half of the year(1).
S&P Global, S&P 500® Index Data
Small Caps and Emerging Markets Take the Lead
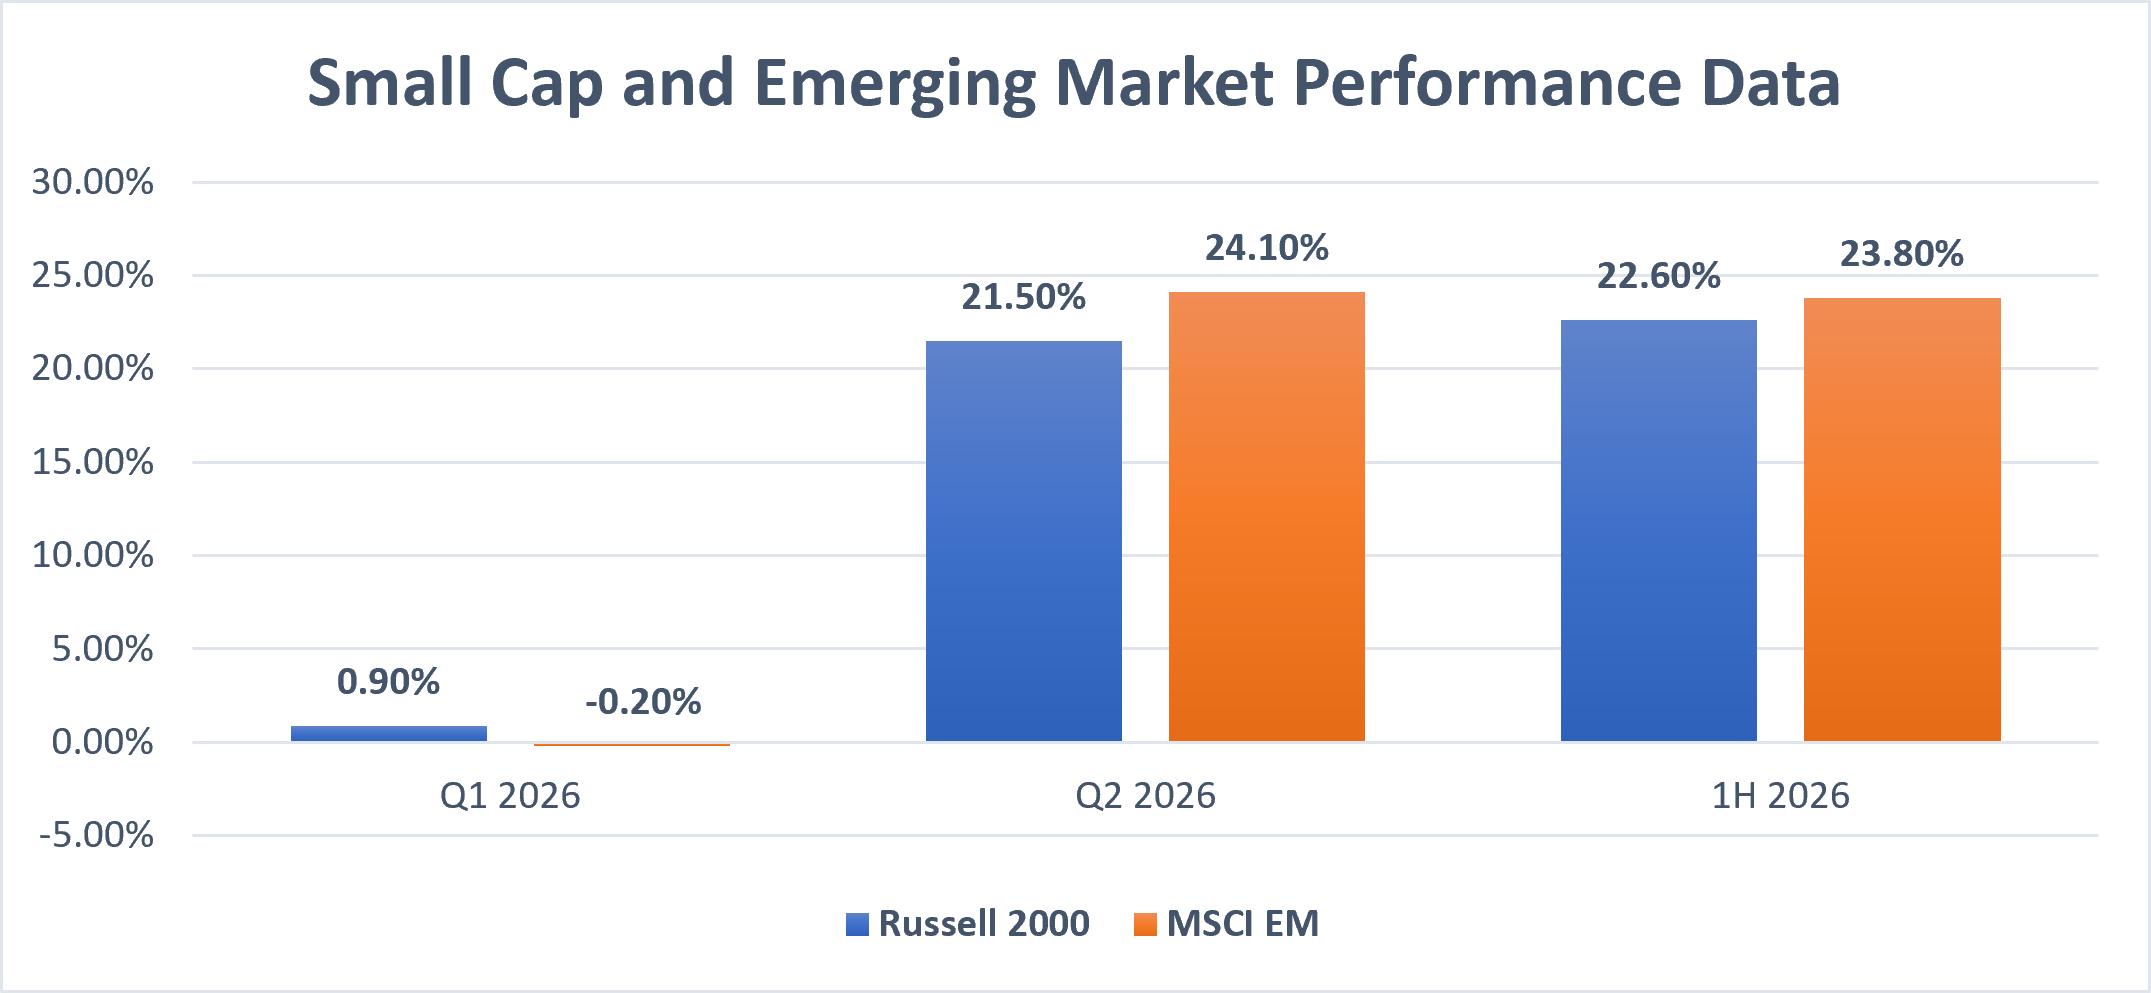
For much of the last few years, mega-cap technology stocks have commanded all the attention. However, Q2 2026 saw a significant broadening of the market, with small-cap equities and emerging markets heavily outperforming their large-cap peers. There were a number of factors that contributed to the rotation.
First, the global artificial intelligence (AI) supply chain proved to be a boom for emerging markets. The physical infrastructure required to power AI (semiconductors, memory chips, and electronic components) are largely manufactured overseas in emerging market countries. This demand spurred business growth for companies located in those countries.
Secondly, the US economy proved to be more resilient than many assumed. Small-cap stocks are generally more sensitive to the health of the domestic economy, as they rely heavily on everyday consumer spending and local business activities. Labor markets remained healthy and Gross Domestic Product (GDP) growth was stable, giving investors the confidence they needed to invest in smaller companies.
Lastly, the easing geopolitical tensions and improved trading conditions were powerful tailwinds for both small-cap and emerging markets. For emerging market countries, the falling oil prices reduced a major economic burden, and for small-cap domestic companies, falling transportation costs provided immediate relief to their bottom lines(2).
Yahoo Finance, Russell 2000 Index & MSCI Emerging Markets Index
The Energy Rollercoaster
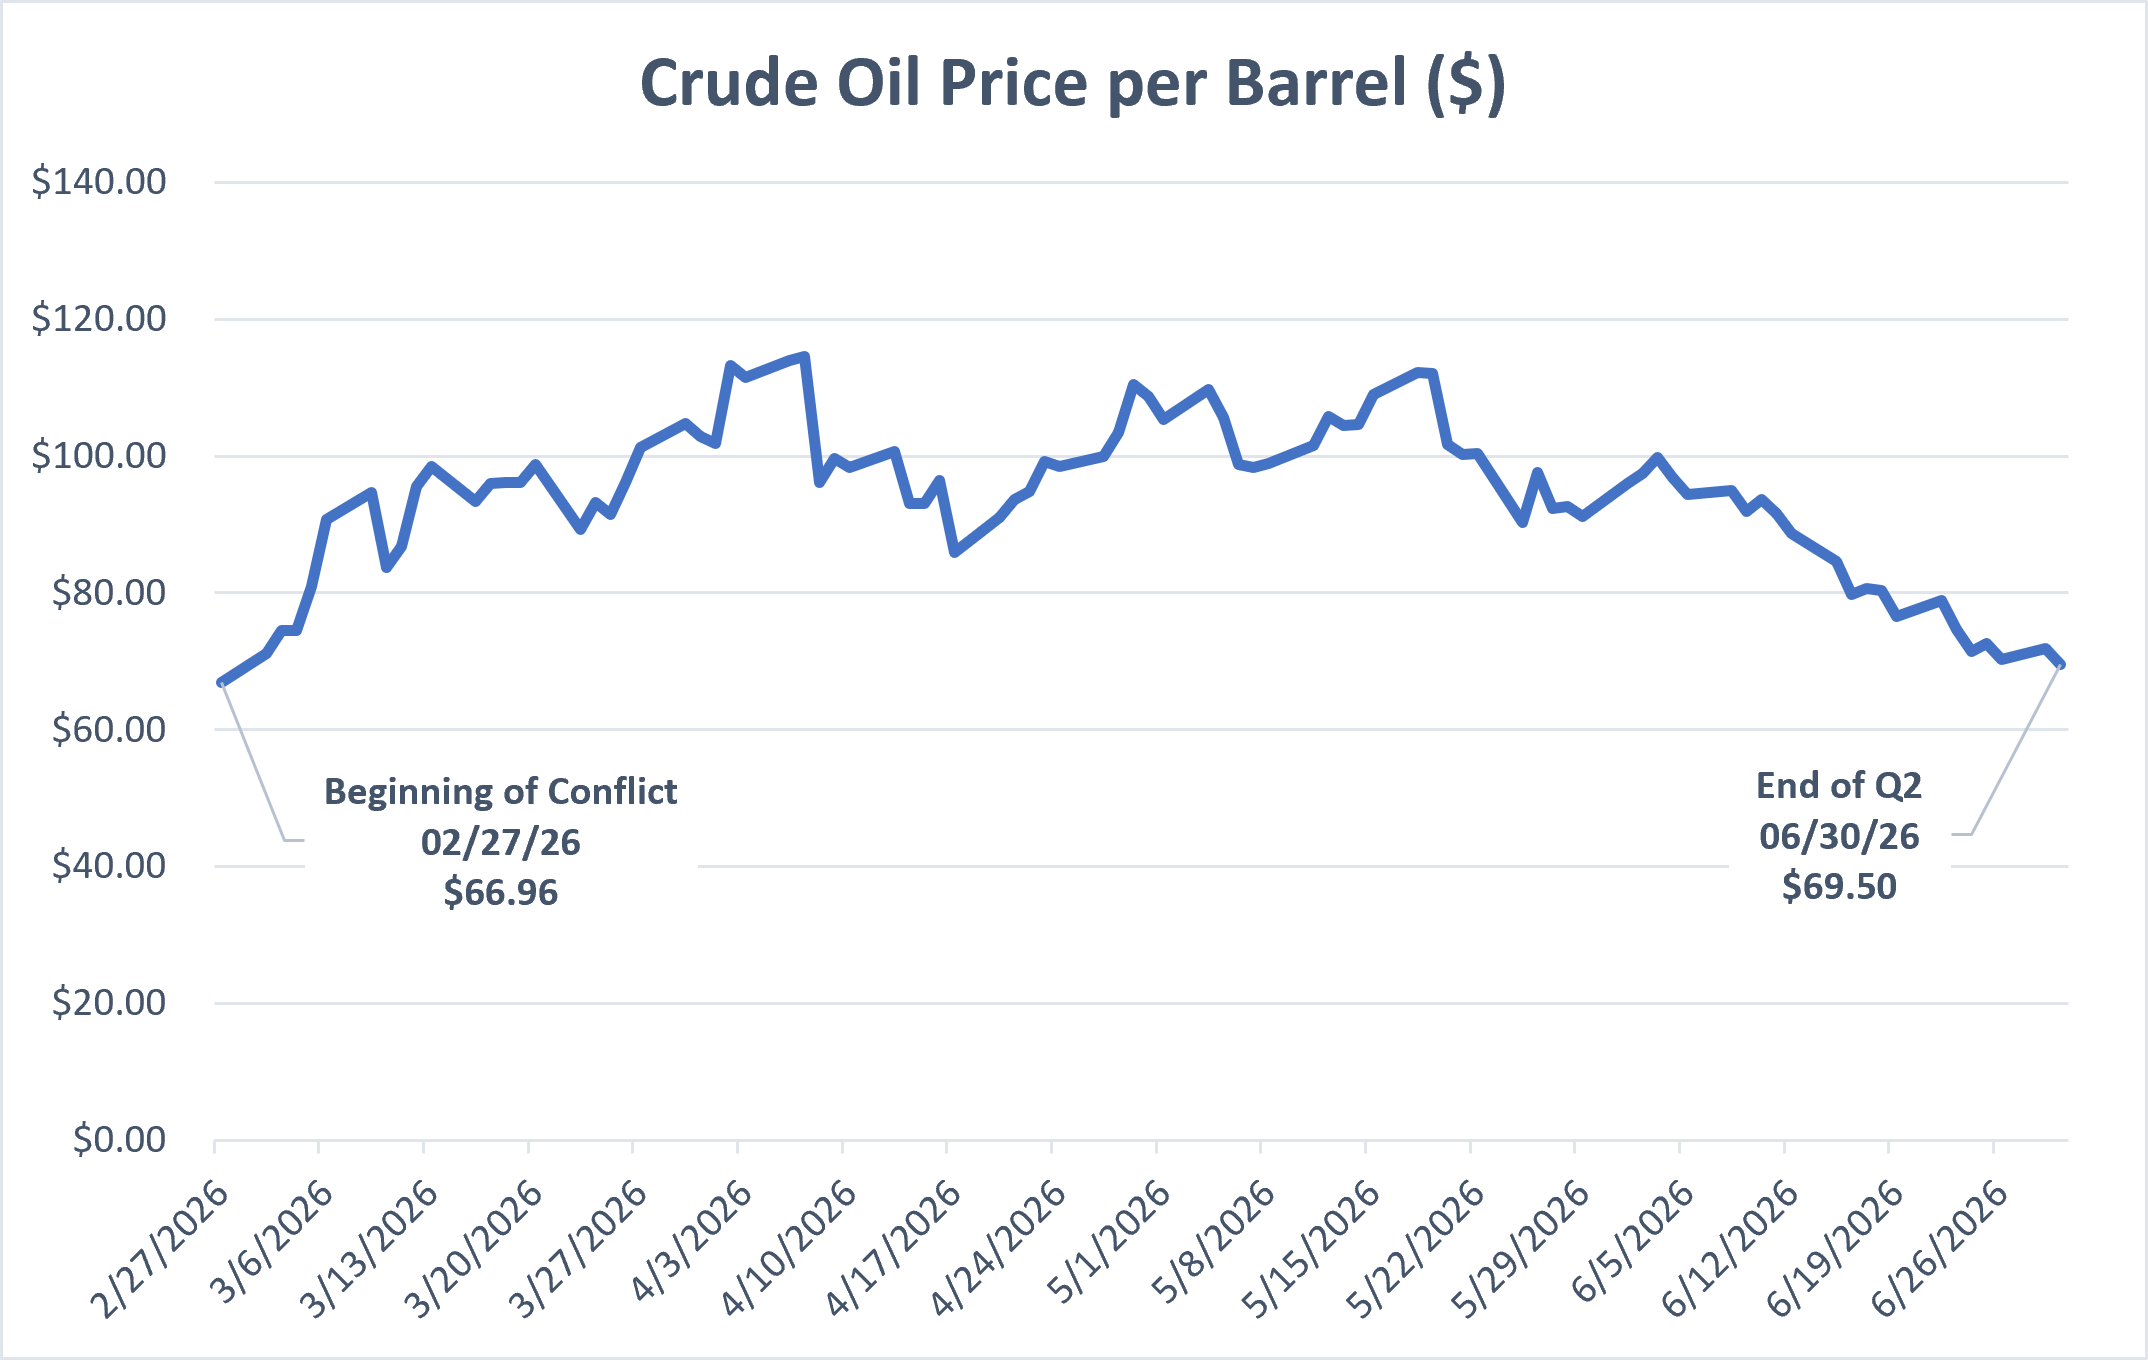
The conflict in the Middle East during Q1 sent shockwaves through energy markets, causing major price fluctuation for one of the world’s most valuable resources. Oil experienced the largest supply shock in history, with prices spiking heavily and causing pain at the pump for consumers around the globe. Relief came in Q2 in the shape of easing geopolitical tensions and increased traffic through the Strait of Hormuz back towards pre-conflict levels(3).
Oil markets, not unlike many major markets, reacted quickly to seemingly every briefing from the White House, rising and falling over the quarter before settling in towards the end of Q2.
This will be an interesting market to watch over the coming weeks and months. Even as we write this, the ceasefire and Memorandum of Understanding appear to be on uneven ground, and every threat of re-escalation has an impact on global oil transportation and traffic through the Strait of Hormuz. If cooler heads can prevail, we expect to see prices remain at the levels we’ve become more accustomed to.
Macrotrends, WTI Crude Oil Prices, https://www.macrotrends.net/2516/wti-crude-oil-prices-10-year-daily-chart
The Historical SpaceX IPO
The financial world witnessed a historic milestone in June 2026 when SpaceX officially became a publicly traded company. After years of operating privately, the highly anticipated IPO captured the attention of both institutional and retail investors. Priced at $135 per share under the ticker symbol SPCX, the SpaceX IPO became the largest in history. The offering raised approximately $75 billion, assigning the company a staggering initial valuation approaching $1.77 trillion.
A unique feature of this offering was its heavy tilt toward everyday investors; roughly 30% of SpaceX’s offering was earmarked for retail investors, which injected significant retail capital into the public markets and created a surge of trading volume and enthusiasm.
Despite the initial excitement, the early trading activity of SPCX serves as a classic case study in IPO volatility. After an initial surge that briefly pushed shares above $220 in the days following the IPO, the stock quickly pulled back, settling closer to the $150 to $160 range by late June(4).
This type of price movement highlights the inherent risks associated with newly public companies. While mega-IPOs can dominate financial news cycles and create a fear of missing out, they also introduce significant price discovery risks as the market attempts to find balance between a company’s ambitious vision and its current fundamental valuation.
Summary
Following a volatile first quarter marked by geopolitical shocks, the second quarter of 2026 delivered a strong market rebound defined by economic resilience and an easing of geopolitical tensions. As Middle East peace talks progressed and traffic through the Strait of Hormuz normalized, the energy markets stabilized, allowing oil prices to return to pre-conflict levels. This stabilization, combined with an outstanding corporate earnings season, drove up large-cap equities.
Another key theme of the quarter was significant market rotation, with small-cap and emerging market equities outperforming their large-cap peers. Emerging markets experienced a tailwind from the global AI boom, as overseas manufacturers of semiconductors and AI infrastructure saw business growth. Meanwhile, domestic small-cap stocks capitalized on a surprisingly resilient US economy, benefiting from stable GDP growth, healthy labor markets, and falling transportation and energy costs.
The quarter concluded with a historic milestone: the highly anticipated IPO of SpaceX, which became the largest in history and sparked massive market enthusiasm and trading volume. However, the stock’s sharp, and somewhat immediate, volatility serves as an excellent case study for investors.
If there are any topics you would like us to address in the future, please let us know.
Sources
First Business Bank, Quarterly Market Review, https://firstbusiness.bank/resource-center/quarterly-market-review/
Glenmede, Q2 2026 Market Review, https://info.glenmede.com/q2-2026-market-review-lp
Cerity Partners, Q2 in Review, https://ceritypartners.com/insights/q2-2026-review-and-q3-2026-economic-and-market-outlook/
Yahoo Finance, Space Exploration Technologies Corp, (SPCX), https://finance.yahoo.com/quote/SPCX/
Disclosures
Investment advisory services offered through Elevate Wealth Management, LLC, a registered investment advisor. The firm’s ADV 2A Brochure and Form CRS are available, at no charge, by request at information@elevateasset.com or 307.461.5550 and are available on our website www.elevateasset.com. They include important disclosures and should be read carefully.
Information provided herein reflects Elevate’s views as of the date of this newsletter and can change at any time without notice. Elevate obtained some of the information provided herein from third party sources believed to be reliable, but it is not guaranteed and Elevate does not warrant or guarantee the accuracy or completeness of such information. The use of such sources does not constitute an endorsement. Elevate’s use of external sources should in no way be considered a validation. The views and opinions of these authors are theirs alone. Reader accesses the links or websites at their own risk. Elevate is not responsible for any adverse outcomes from references provided and cannot guarantee their safety. Elevate does not have a position on the contents of these articles. Elevate does not have an affiliation with any author, company or security noted within.
Past performance is no guarantee of future returns. Performance discussed represents total returns that include income, realized and unrealized gains and losses. Nothing presented herein is or is intended to constitute investment advice or recommendations to buy or sell any types of securities and no investment decision should be made based solely on information provided herein. There is a risk of loss from an investment in securities, including the risk of loss of principal. Different types of investments involve varying degrees of risk, and there can be no assurance that any specific investment will be profitable or suitable for an investor’s financial situation or risk tolerance. Diversification and asset allocation do not ensure a profit or protect against a loss. All performance results should be considered in light of the market and economic conditions that prevailed at the time those results were generated. Before investing, consider investment objectives, risks, fees and expenses.
Exclusive reliance on the information herein is not advised. This information is not intended as a recommendation to invest in any particular asset class or strategy or as a promise of future performance. References to future returns are not promises or even estimates of actual returns a client portfolio may achieve. Assumptions, opinions and estimates are provided for illustrative purposes only. They should not be relied upon as recommendations to buy or sell any securities, commodities, treasuries or financial instruments of any kind. This material has been prepared for information purposes only and is not intended to provide, and should not be relied on for, accounting, legal, investment or tax advice.
In reviewing the performance information presented here, we recommend that you consider both the returns generated and the level of risk that was assumed in generating those results. We believe that performance information cannot be properly assessed without understanding the amount of risk that was taken in delivering that performance. The performance information presented here covers different time periods. We present performance information for short time periods because we understand that clients and potential Investors are interested in this information, however, we recommend against making any investment decisions based on short-term performance information. For any investment products mentioned herein, a complete description of their investment objectives, along with details of the risks and fees involved is contained in their respective prospectus and statement of additional information, which is available on their websites and should be read fully.